


let's see what is statistics? and how are we gonna get benefit from it ?🤔
Statistics
Collection , Analysis , Interpretation and presentation of Data.
- Organizing and summarizing data is called Descriptive Statistics. Thinking about summarizing numerical data, there are two ways, we can summarize data by using graph or by using numbers. For ex: Finding average , sum etc.
- Drawing conclusion from the data is called Inferential Statistics. It uses probability to determine how good we are at drawing conclusion from data.
It uses "Mathematical Model" in order to describe the data that belongs to real world! "Statistical Model" is special type of Mathematical Model that is helpful in drawing conclusion in which one set of values is helpful in determining other set of values that is likely to be occur in future. (For example : Weather forecasting helps in predicting how the weather will be tomorrow like that!!)
Probability
Probability is used to determine how likely the event will occur! In simple terms, it is just mathematical tool in order to study randomness. For example :
- whether you will get A in this course,we use probability.
- Likelihood of an earthquake, of rain.
Back to Stat!
Like jargon alert from statquest!
Population : Study of group of something (Something can be things,students,values from weather sensors etc..).
Fake Scenariooo!
Imagine, what if our group contains millions of values(weather data or marksheets of entire university)... 🥴 our head explode seeing all the things, similar to that computers are mostly used to mess with statistical models. Even our normal PC cant handle unlimited data. So we are not going to use all data (ie population). Instead we are going to use some amount of data (ie Sample) to analyze our data and draw some useful conclusion from it! 🥱
How it is done then huh!
- Select a portion from population and study that portion to gain information about the population.
- The result will be Data
Now, we are going to learn some jargon that people use in statistics!
Statistic - characteristic of sample (result of some mathyy stuff),single value Parameter / Population Parameter - characteristic of population (result of some mathyy stuff),single value
Now we want to ensure that statistic is equal to or atleast near to the value of whole population parameter.
Quick Note💀: We will calculate population parameter from entire population and statistic from the sample we took!
Why we are comparing thatttt ? We are comparing in order to make sure that our statistic represents the whole population. wait whatt? yes we took sample in order to avoid messing up with whole population. so we have to make sure that the sample we took represents population. Statistic is estimate of population parameter!. that's what represents how accurate we are in analyzing whole population by using Sample from them.
representative sample = sample is being equal or nearer to population parameter!
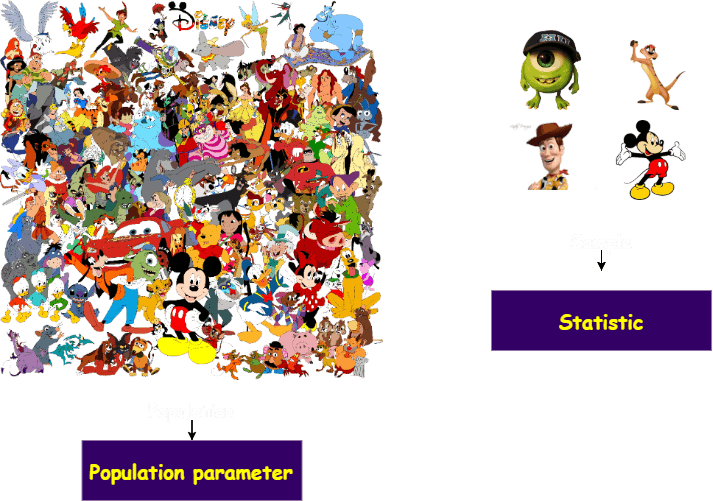
Here, All of the disney character belongs to population. And sample here is one of the character that represents whole crew.
Next up, Variable (sorta like box which has balls inside it... name of box here is variable and how many balls in it are its value) variable is assigned some value in order to understand some data.. for example ... black box = 5 (black box contains 5 balls like that! tada)
here in statistic, we often represent X,Y as variable.
- value of the variable can be Numerical or Categorical
- Numerical here may be height,weight,temperature etc
- Categorical here may be like which group person belongs too For ex: republican,democrat,Libertarian etc.
If we mess up with Numerical here, we can find some numerical result like average, sum etc.
But, messing up with Categorical is not fun thing to do nor it can be done easily so for now! Jargon alert is overrrr! wait just two more!
- Mean - same as the average - if 5 students scored 100,95,90,100,80 then average can be found out by (100+95+90+100+80)/5 = 93( ie average/mean)
- Proportion - What amount of me is there in population. Sorta like Fraction! total dishes in resturant = 24 what i want or have = 8 then proportion of me is 8/24. That's ittt!!!
Here we go, we have done with Our first part in this statistics series! 🥳 Next we will look upon our focus on sampling techniques,type of data and more!
Reference :